Endee vs Qdrant

When we set out to build Endee, we made one promise: best-in-class performance without compromise. Not theoretical performance - real, reproducible numbers on standardised benchmarks that anyone can run.
So we did exactly that. We ran Endee head-to-head against Qdrant on the industry-standard VectorDBBench framework, using the Cohere 1M dataset at 768 dimensions - the same setup used to compare vector databases across the ecosystem. The results were decisive.
Test Setup
All tests were run under identical infrastructure conditions to ensure a fair comparison.
| Parameter | Qdrant | Endee |
|---|---|---|
| Hardware | 4 vCPU / 16 GB RAM | 4 vCPU / 16 GB RAM |
| Dataset | Cohere 1M vectors, 768D | Cohere 1M vectors, 768D |
| Benchmarking Tool | VectorDBBench | VectorDBBench |
| Precision | float32 | int16 |
Note on precision: Endee uses int16 quantisation by default. This is not a shortcut- it is a deliberate architectural choice that compresses memory footprint by ~2x while actually improving throughput and latency, as the numbers below demonstrate.
Benchmark 1: Recall at ~250 QPS
The first test measures how accurately each database returns the correct nearest neighbours at a sustained query rate of ~250 QPS, across multiple Top-K values.

| Top-K | Qdrant Recall | Endee Recall | Endee Advantage |
|---|---|---|---|
| 15 | 0.9919 | 0.9987 | +0.68% |
| 30 | 0.9917 | 0.9984 | +0.67% |
| 50 | 0.9910 | 0.9976 | +0.66% |
| 100 | 0.9870 | 0.9944 | +0.74% |
Endee delivers higher recall across every Top-K value tested. The gap widens at Top-K=100, where precision matters most - for applications like recommendation engines, semantic search, or RAG pipelines that need to surface a broad candidate set reliably.
At Top-K=100, Endee's recall of 99.44% versus Qdrant's 98.70% may look like a small margin- but at production scale, that 0.74% difference translates directly to relevance quality for your end users.
Benchmark 2: QPS vs Concurrency (at ~97.3% Recall)
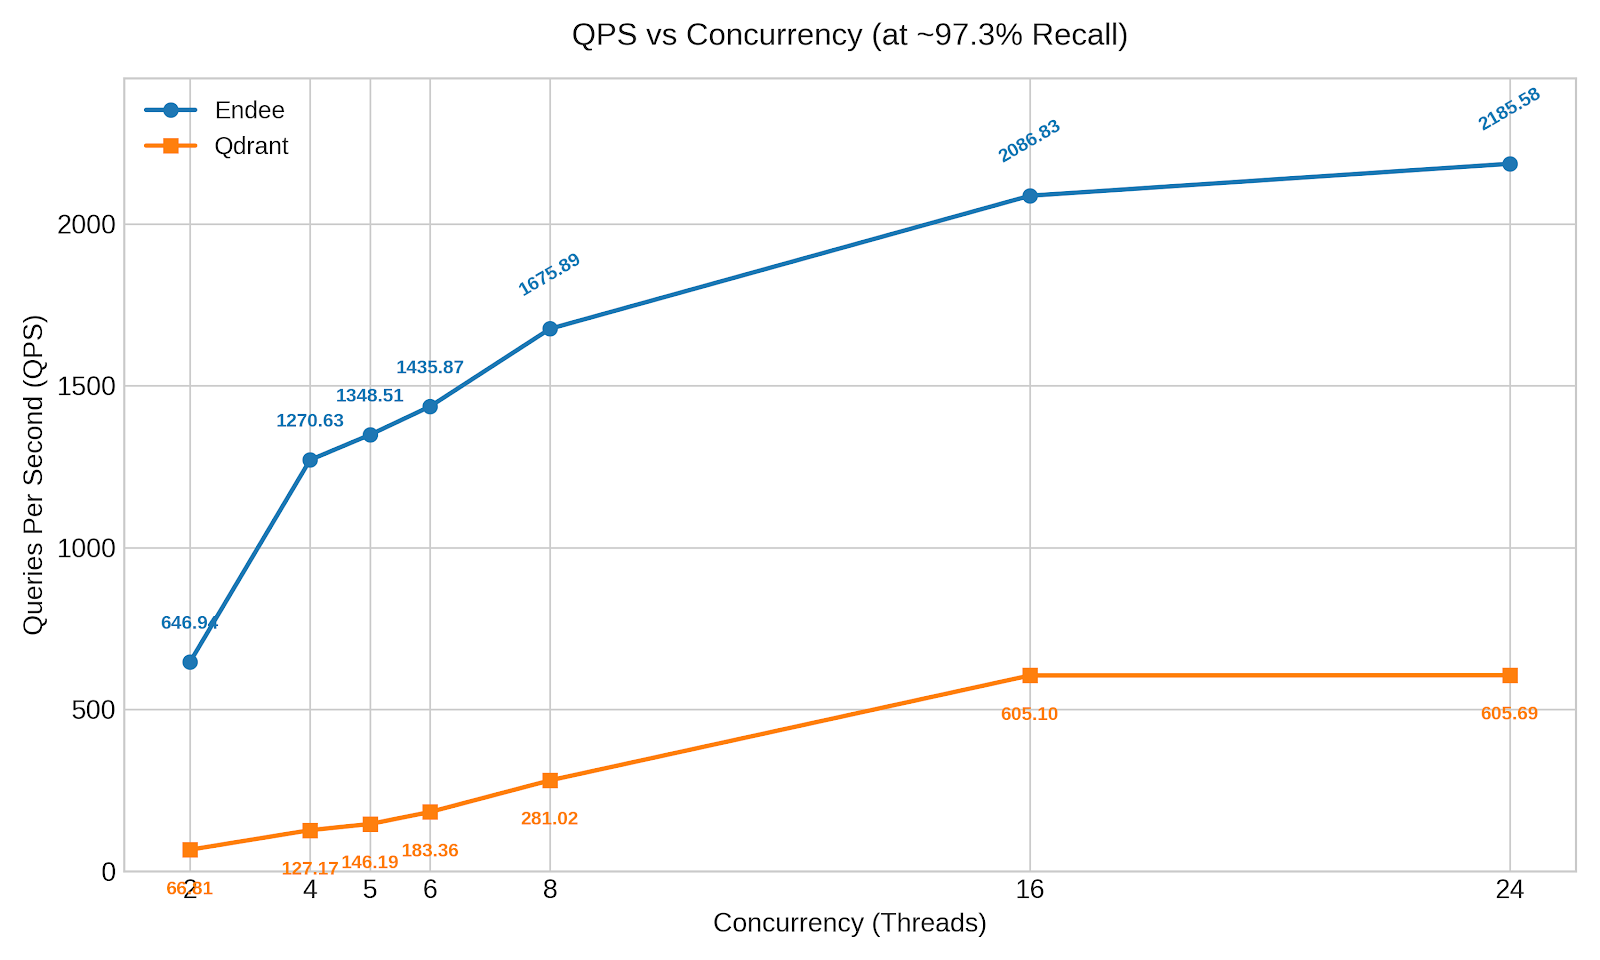
This test holds recall constant at ~97.3% for both databases (97.30% for Qdrant, 97.32% for Endee) and measures how many queries per second each system can serve as concurrent load increases. This is the throughput test - the one that determines how far your infrastructure can scale before you need to add more nodes.
| Concurrency | Qdrant QPS | Endee QPS | Endee Advantage |
|---|---|---|---|
| 2 | 66.81 | 646.94 | 9.7× |
| 4 | 127.17 | 1,270.63 | 10.0× |
| 5 | 146.19 | 1,348.51 | 9.2× |
| 6 | 183.36 | 1,435.87 | 7.8× |
| 8 | 281.02 | 1,675.89 | 6.0× |
| 16 | 605.10 | 2,086.83 | 3.4× |
| 24 | 605.69 | 2,185.58 | 3.6× |
Endee sustains up to 10× higher QPS than Qdrant at equivalent recall. At low concurrency (2–5 threads), the gap is the most dramatic - Endee is already handling 646–1,348 QPS while Qdrant is still in the double digits. Even at peak concurrency (24 threads), Endee delivers 2,185 QPS vs Qdrant's 605 - a 3.6× advantage.
This matters enormously for cost efficiency. Higher QPS per node means you need fewer nodes to serve the same production traffic, directly reducing your infrastructure bill.
Benchmark 3: P99 Latency vs Concurrency (at ~97.3% Recall)
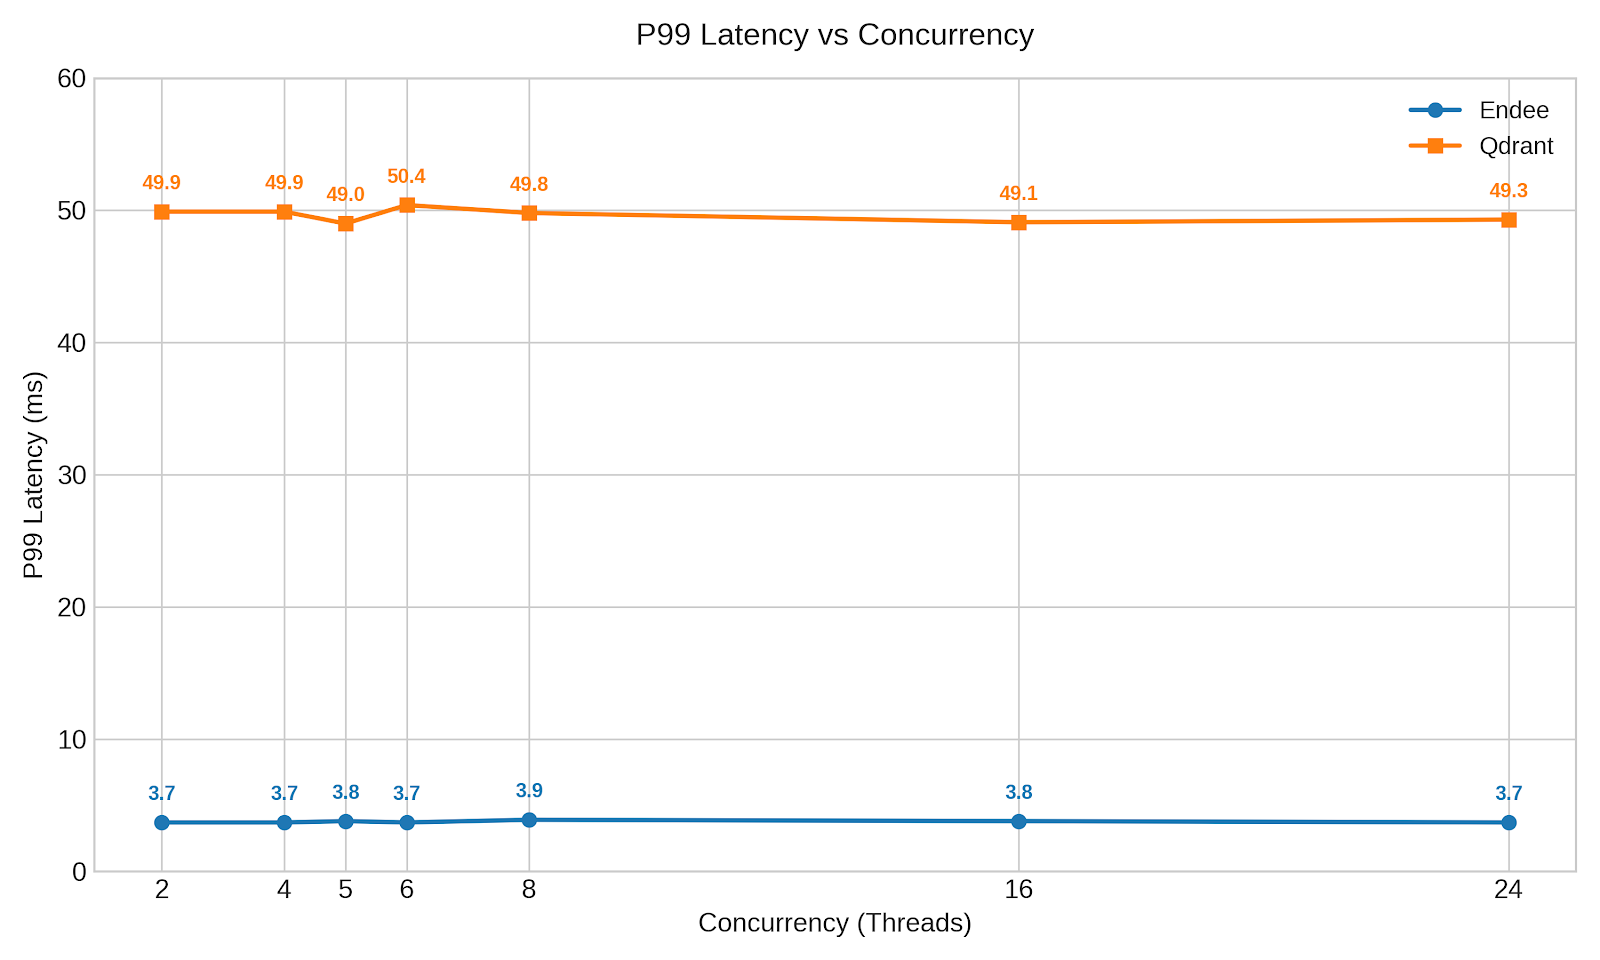
Throughput tells you how much work a system can do. Latency tells you how fast each individual user experiences it. This test measures P99 latency - the worst-case response time experienced by the slowest 1% of queries - as concurrency scales.
| Concurrency | Qdrant P99 Latency | Endee P99 Latency | Endee Advantage |
|---|---|---|---|
| 2 | 49.9 ms | 3.7 ms | 13.5× |
| 4 | 49.9 ms | 3.7 ms | 13.5× |
| 5 | 49.0 ms | 3.8 ms | 12.9× |
| 6 | 50.4 ms | 3.7 ms | 13.6× |
| 8 | 49.8 ms | 3.9 ms | 12.8× |
| 16 | 49.1 ms | 3.8 ms | 12.9× |
| 24 | 49.3 ms | 3.7 ms | 13.3× |
Endee's P99 latency is ~13× lower than Qdrant's, and it stays flat as concurrency grows.
Qdrant's P99 latency hovers between 49–50 ms across all concurrency levels - which means it hits a latency ceiling early and never improves. Endee, by contrast, maintains sub-4 ms P99 latency consistently from 2 to 24 concurrent threads. This is the signature of an architecture built for low-latency access patterns, not one that degrades gracefully under load.
For latency-sensitive applications - real-time recommendations, AI copilots, fraud detection, in-game search - the difference between 3.7 ms and 49.9 ms is the difference between a seamless experience and a noticeable pause.
Summary: Endee vs Qdrant at a Glance
| Metric | Qdrant | Endee | Winner |
|---|---|---|---|
| Recall @ Top-100 | 98.70% | 99.44% | ✅ Endee |
| Peak QPS (concurrency 24) | 605 QPS | 2,185 QPS | ✅ Endee (3.6×) |
| Peak QPS (concurrency 4) | 127 QPS | 1,271 QPS | ✅ Endee (10×) |
| P99 Latency (any concurrency) | ~49–50 ms | ~3.7–3.9 ms | ✅ Endee (13×) |
| Latency stability under load | Flat ceiling at ~50 ms | Flat floor at ~3.7 ms | ✅ Endee |
Why Does Endee Perform This Way?
These results come from deliberate architectural decisions, not hardware tricks:
- int16 quantisation: Endee's default int16 precision reduces memory bandwidth pressure significantly compared to float32, enabling faster in-memory operations without sacrificing recall - in fact, improving it.
- Optimised HNSW implementation: Endee's graph traversal engine is built from the ground up for high-concurrency workloads, avoiding the bottlenecks that appear in standard HNSW implementations at scale.
- Memory efficiency: Endee's 10× lower memory footprint (compared to competitors) means more of the index fits in cache, reducing cache-miss latency at query time.
Get Started with Endee
If you're running vector search at scale and these numbers are relevant to your architecture decisions, we'd love to talk.