What Are Vectors? A Beginner-Friendly Guide


The village, the lion, and “partial truth”
Let’s take a village where nobody has ever seen a lion. One day, a huge unknown animal is brought in front of them, and the villagers are curious: What is this creature? The lion is kept in a small and dark tent, people can only go in one at a time and touch a single part of the animal.
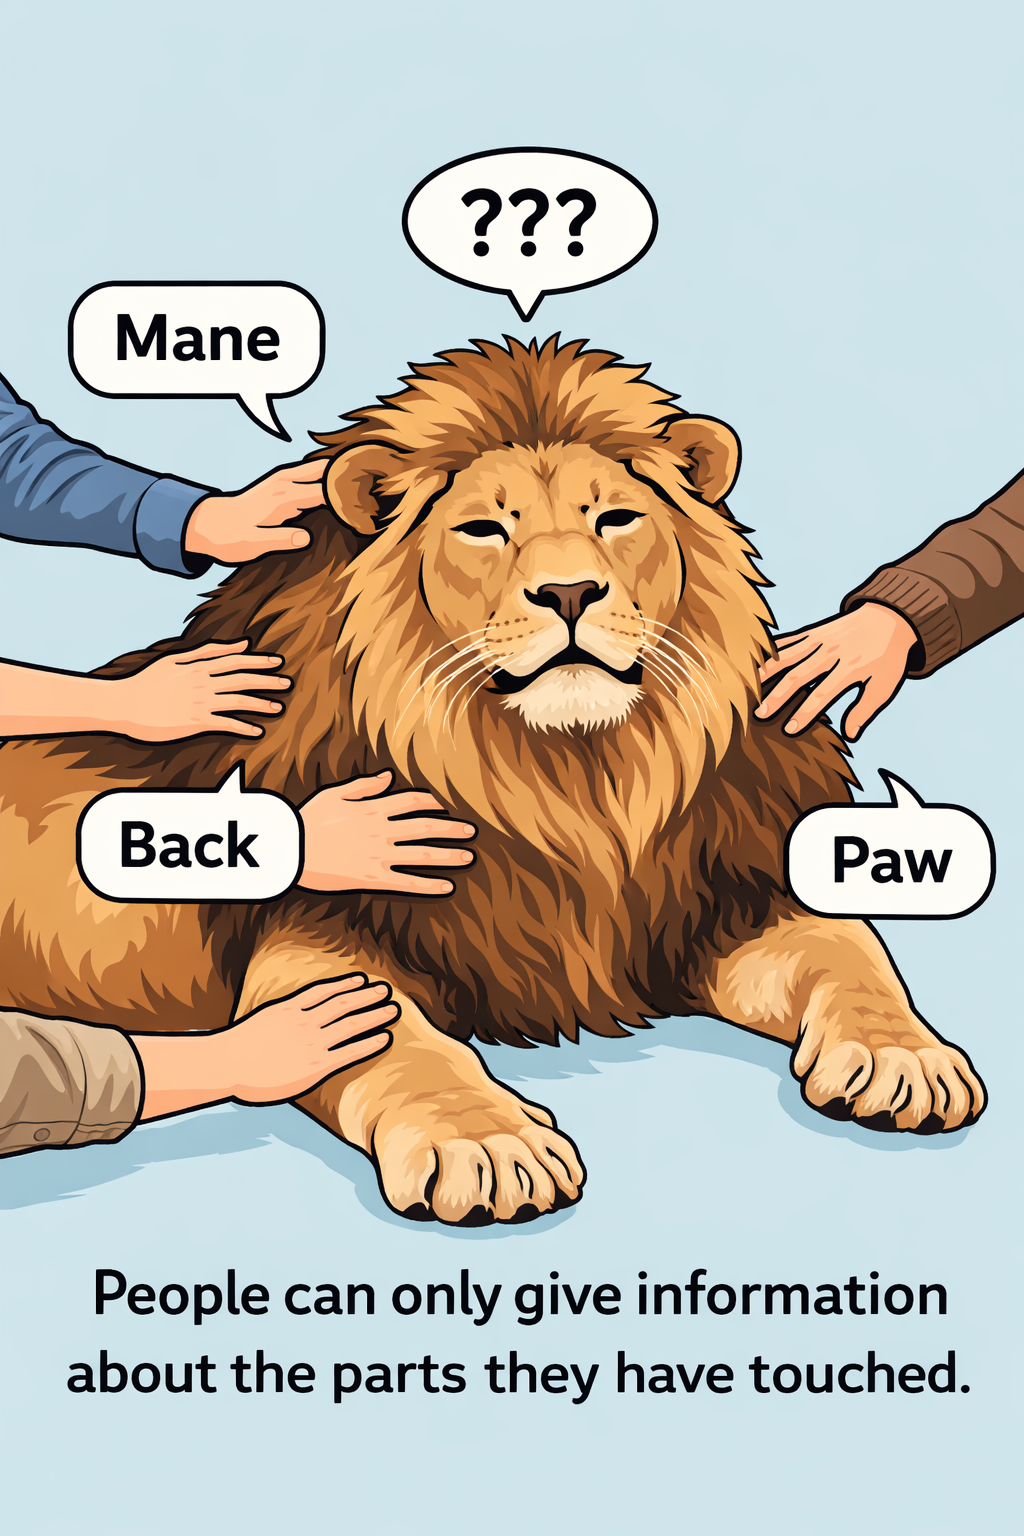
Each person feels something different: thick hair around the head, heavy paws, a long tail with a tuft, sharp teeth, or a strong muscular body. When asked what the animal is, everyone gives a different answer-horse, dog, cow, wolf, tiger.
Everyone is partly right, yet completely wrong.
Each villager observed a real attribute but tried to infer the whole animal that attribute alone. Only when all observations are combined does the full picture emerge: a lion.
What this teaches us:
-
Partial observations can be misleading.
-
True representation requires identification of many features.
Vectors
To represent a real-world object on machines, we use vectors.
A vector is simply a list of floating point numbers, where each number captures one independent feature of a given object. Objects can be documents, images, video etc. The cardinality of the vector (also called the dimension) is the number of independent features this object is represented with; so, if we define a lion based on 5 features then the dimension of its vector 5.
Think of each villager’s observation:
- Mane length
- Paw size
- Tooth sharpness
- Tail shape
- Body strength
The value of each dimension in the vector encodes how strongly a feature is present in that object.
Representation of Vector
Visually, a vector is a point in an n-dimensional space that has a direction and a magnitude with respect to the origin.
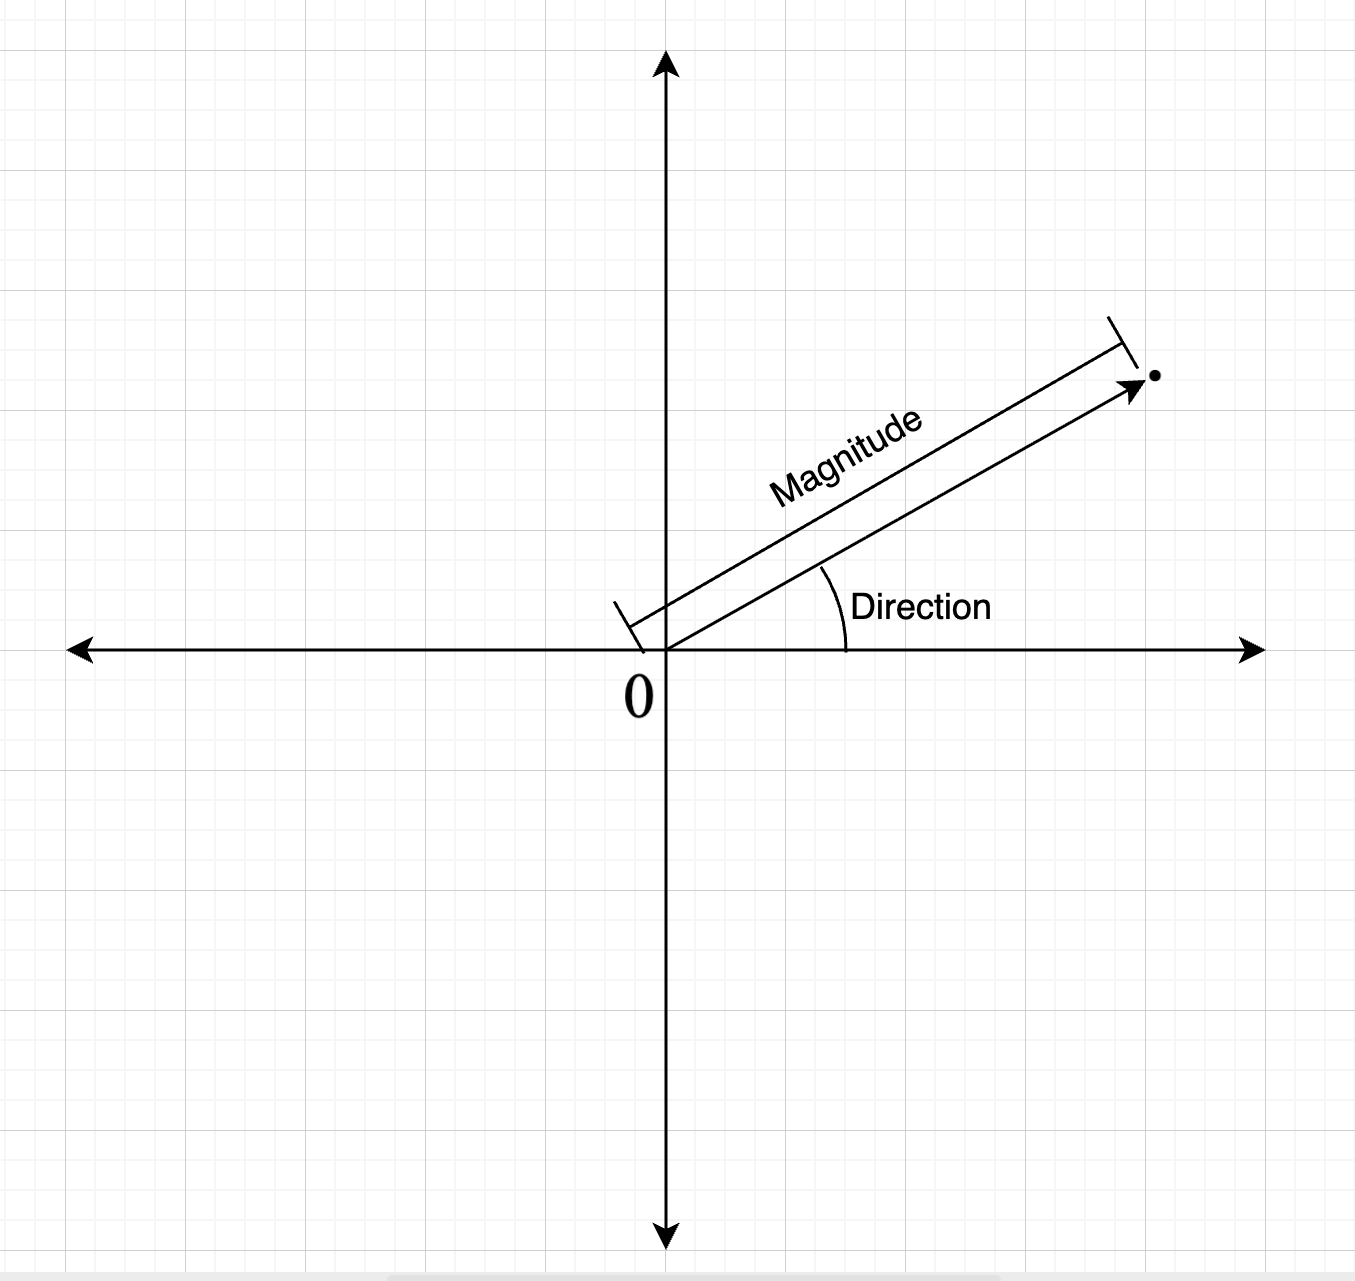
Formally we can represent a vector as:
The Lion as Vector
If we make each observation a dimension in its vector representation, the lion vector would look something like:
| Feature (dimension) | Meaning | Value |
|---|---|---|
| x₁ | Mane thickness | 0.9 |
| x₂ | Paw strength | 0.8 |
| x₃ | Tooth sharpness | 0.95 |
| x₄ | Tail tuft prominence | 0.7 |
| x₅ | Body muscle strength | 0.9 |
Typically what features to put in a vector format is not a straight forward task. So, people have come up with embedding models that do this automatically for us.
Distance
Using vector representation, we assume that points that are near each other in the vector space are considered "similar".
This notion of “distance” is quantified using different distance measures. Some typically used distance measures are:
- L2 Distance (Euclidean distance)
- Cosine Similarity
- Dot Product
Not all distance measures work similarly for a given problem statement. So, it is imperative to understand what each one of them captures. Let us go through them carefully.
1. Euclidean Distance (L2 Distance)
Euclidean distance is the shortest distance between two points in the vector space. This distance is calculated using the Pythagoras theorem.
Let's say we have two vectors and in a 2D space. Visually:
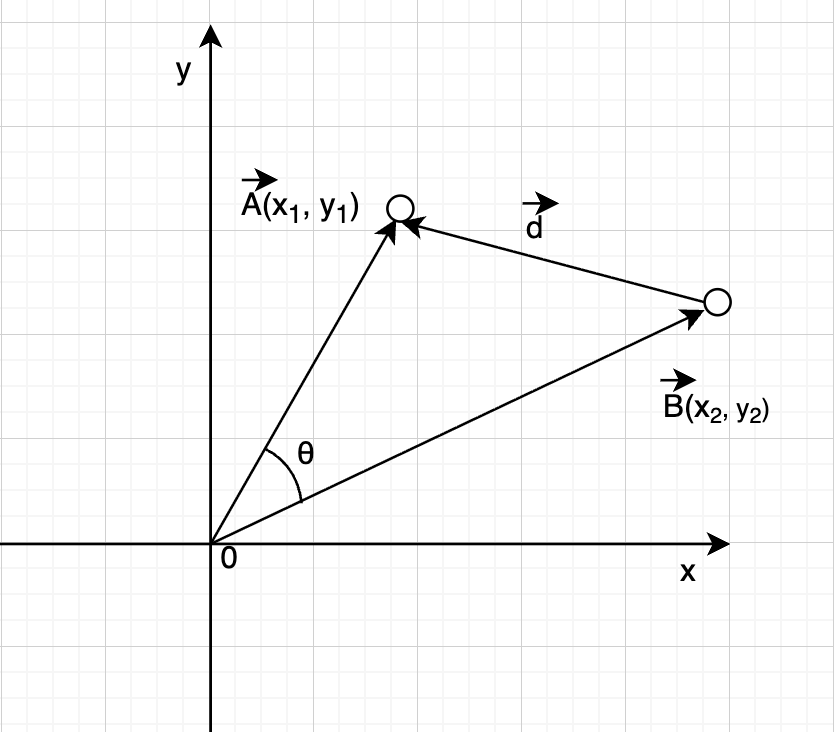
shortest distance between and is .
For n dimensional space, let's consider has n features and has n features.
import numpy as np

import numpy as np

# Two vectors
a = np.array([0.9, 0.8, 0.95, 0.7, 0.9])   # Lion
b = np.array([0.85, 0.75, 0.9, 0.6, 0.88]) # Tiger

# Apply Euclidean distance formula
# |d| = sqrt( sum( (a_i - b_i)^2 ) )

squared_diff = (a - b) ** 2          # (a_i - b_i)^2
sum_squared_diff = np.sum(squared_diff)
distance = np.sqrt(sum_squared_diff)
print(distance)

# output: 0.13379088160259653
Euclidean distance (L2 distance) works well for clustering data into groups.
Cosine Distance
Cosine distance considers vectors in the same direction to be similar. It does not consider the magnitude of the vectors while calculating the distance.
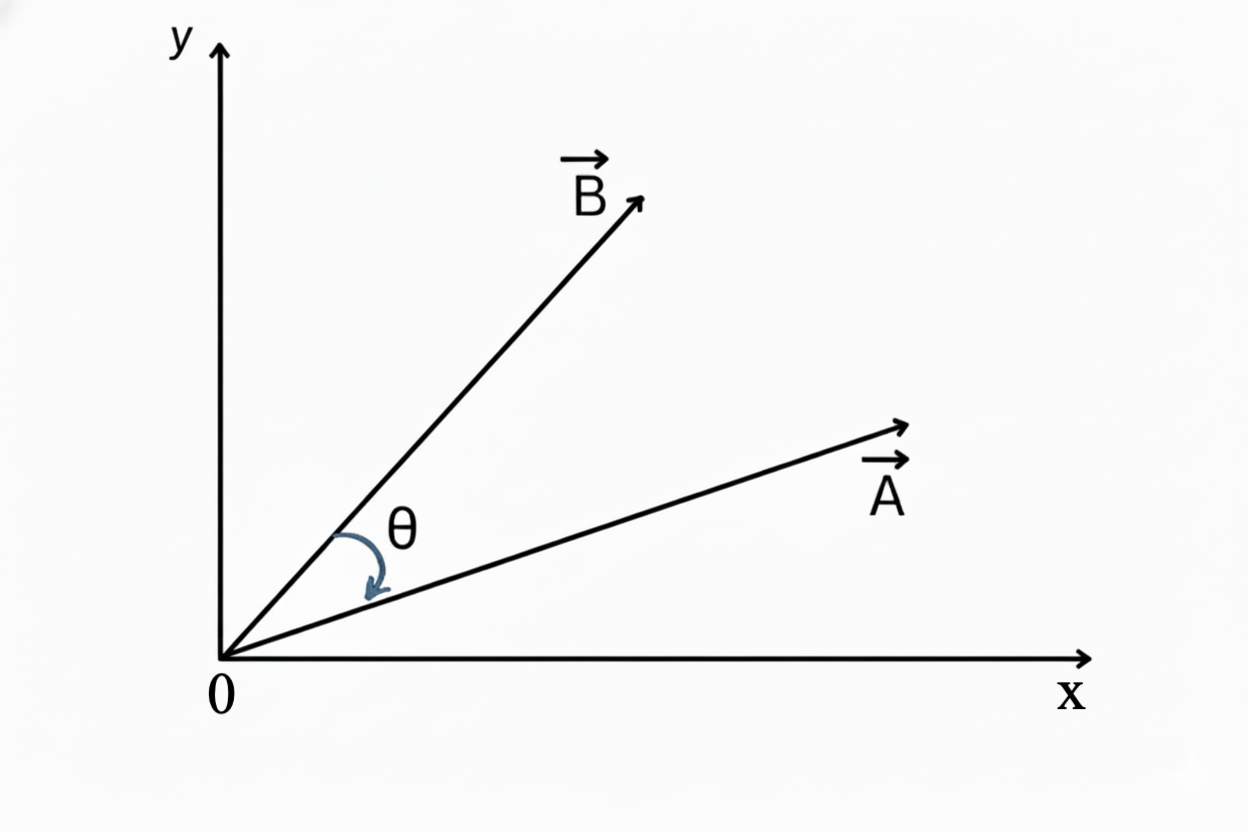
Mathematically:
A large angle (θ) between two vectors means that they are less similar to each other.
- If θ = 0°, the and vectors are very similar; cosine distance is 1.
- If θ = 90°, the and vectors are completely dissimilar (orthogonal); cosine distance is 0.
- Even if two similar data objects are far apart by their euclidean distance they can be similar in cosine distance.
import numpy as np

# Define vectors
A = np.array([0.9, 0.8, 0.95, 0.7, 0.9])   # Reference vector (Lion)
B = np.array([0.85, 0.75, 0.9, 0.6, 0.88]) # Similar animal (Tiger-like)
C = np.array([0.9, 0.1, 0.05, 0.9, 0.05])    # Very different animal

# Step 1: Dot products
dot_A_B = np.dot(A, B)
dot_A_C = np.dot(A, C)

# Step 2: Magnitudes
mag_A = np.sqrt(np.sum(A**2))
mag_B = np.sqrt(np.sum(B**2))
mag_C = np.sqrt(np.sum(C**2))

# Step 3: Cosine similarity
cos_A_B = dot_A_B / (mag_A * mag_B)
cos_A_C = dot_A_C / (mag_A * mag_C)

print("cos(A, B):", cos_A_B)
print("cos(A, C):", cos_A_C)

# output:
# cos(A, B): 0.9992893212235371
# cos(A, C): 0.6598507771131416
Used in:
- Search engines
- RAG systems
Inner Product (also known as Dot Product)
Inner product considers both magnitude and direction when calculating the distance between two vectors.
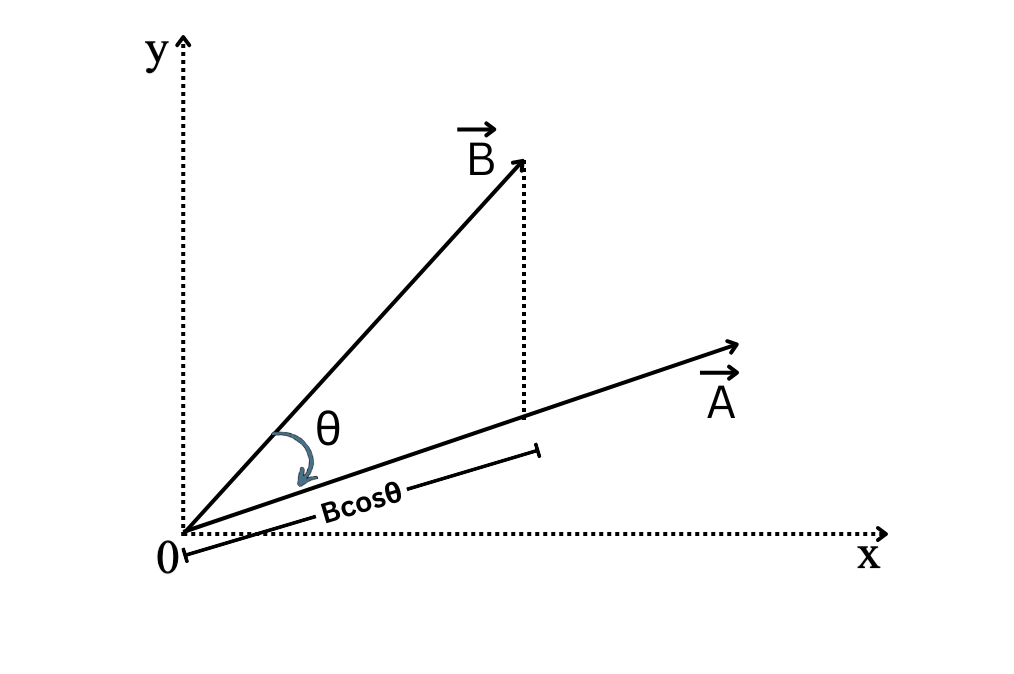
Formally,
or
If vectors are perpendicular that is is 90° it implies that both vectors are independent of each other and therefore dot product will be 0.
Note: As the dimension of our vectors increase, distance becomes less meaningful. This is called the "curse of dimensionality"
The Classification Problem
A computer does not understand animals the way humans do. It never asks "is this a lion?". Instead, it asks "which known vectors is this input vector most similar to?"
Let's say the system has vector representations of some animals:
Lion   → [0.9, 0.8, 0.95, 0.7, 0.9]
Tiger  → [0.85, 0.75, 0.9, 0.6, 0.88]
Dog    → [0.4, 0.5, 0.3, 0.6, 0.4]
Cow    → [0.3, 0.4, 0.2, 0.8, 0.3]
For an input query vector:
x = [0.88, 0.82, 0.93, 0.68, 0.91]
Code:
import numpy as np

# Define vectors
vectors = {
    "Lion":  [0.9, 0.8, 0.95, 0.7, 0.9],
    "Tiger": [0.85, 0.75, 0.9, 0.6, 0.88],
    "Dog":   [0.4, 0.5, 0.3, 0.6, 0.4],
    "Cow":   [0.3, 0.4, 0.2, 0.8, 0.3]
}

x = np.array([0.88, 0.82, 0.93, 0.68, 0.91])

# Cosine similarity function
def cosine_similarity(a, b):
    return np.dot(a, b) / (np.linalg.norm(a) * np.linalg.norm(b))

# Compute similarities
for animal, vec in vectors.items():
    sim = cosine_similarity(x, np.array(vec))
    print(f"similarity(x, {animal}) → {sim:.4f}")
The system compares with every known vector using a given similarity metric, say cosine similarity:
# output:
similarity(x, Lion) → 0.9998
similarity(x, Tiger) → 0.9994
similarity(x, Dog) → 0.9458
similarity(x, Cow) → 0.8321
Since the similarity score for is highest with the known "lion" vector, The system returns that the input vector is most likely a lion.
In this example, we only have a handful of vectors, but in the real world, datasets can contain millions of vectors, each with hundreds or thousands of dimensions. Searching through such high-dimensional data exhaustively is extremely slow and computationally expensive. This introduces the problem of approximate nearest neighbour search.
Choosing the right tool for the job is paramount. Endee offers fast, efficient, scalable and highly accurate similarity search.